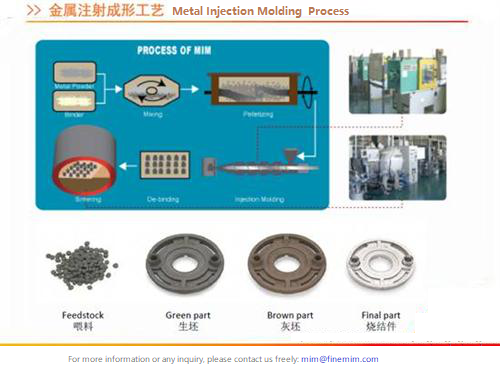
The 2015 China Metal Injection Molding Industry Status Report, published by the Powder Metallurgy Branch Association of the China Steel Construction Society, provides invaluable insight into the recent development of China’s Metal Injection Molding industry.
Sales of MIM parts were reported to be in the region of CNY ¥4.85 billion (US $725 million*), of which sales of CNY ¥3.25 billion (US $485 million) are generated by just five producers or group companies that share 67% of total sales. It was stated that fifteen companies have sales in excess of CNY ¥40 million (US $6 million). The remaining MIM manufacturers were described as small scale.
The report stated that there are now more than 130 MIM part producing companies in China, excluding Taiwan. Of these, the Pearl River Delta is home to 65 producers, the Yangtze River Delta 35 producers and the Beijing, Tianjin, Hebei and Shandong regions 20 producers. The balance of MIM part producers is located in Hunan and other regions.
In terms of application areas, mobile/smartphone parts are the largest market for Metal Injection Molding in China, followed by computer parts, wearable devices, automobile parts, medical instruments and parts for hardware and power tools, etc.
Material consumption and trends
 The total shipment of materials (powders and feedstock) for Metal Injection Molding was given as between 6,000 and 7,000 tons. The report stated that market share is divided equally between domestic and foreign brands. It was estimated in the report that between 3,000 and 3,500 tons of foreign feedstock was imported in 2015.
It was also stated that there are eight domestic producers of MIM powder, each with production capacities in excess of 100 tons per year.
In terms of domestic MIM feedstock production, there are nine manufacturers producing a total of between 800 and 1,000 tons of feedstock per year.
The most widely processed MIM materials in China are stainless steels and low alloy steel, accounting for 85% of production. Of the stainless steels, 316L and 17-4PH are the dominant alloys. Tungsten-based materials account for 10% of production, with cemented carbides, copper-based alloys and titanium alloys accounting for the remaining 5%.
It is expected that there will be a diversification of MIM materials in the near future, including nickel free stainless steel, non-magnetic alloys, aluminium alloys and high thermal conductivity alloys.
Industry outlook
The report anticipates that China’s MIM industry will continue to experience high levels of growth, stating that ever more products are being designed as MIM components. As a relatively new precision forming technology, new materials and innovative designs will lead to an expansion of the market for MIM products.
It was stated that the technology in China is developing rapidly in response to increasing customer requirements. As a result, both the size and levels of precision of Chinese MIM products are expected to increase.
The largest market for the Chinese MIM industry is the consumer electronics sector. It is expected that automotive, wearable devices and medical instruments sectors will grow significantly.
As the size of the MIM industry in China continues to increase, it is anticipated that the number of enterprises will, at the same time, decrease steadily because of competition and changes in end-user markets. Whilst the industry will gradually become more concentrated, the report stated that there will still be opportunities for small, innovative enterprises.
In terms of production technology, the report states that there will continue to be a steady improvement in the quality of domestic MIM production equipment, including vacuum sintering furnaces, catalytic debinding systems and feedstock mixers. Exports of these products are also expected to increase. It was stated that the production and development of continuous sintering furnaces in China will also increase.
*Approximate, based on the exchange rate as of 20 July 2016
